Building a Real Estate Opportunity Engine
I got interested in a specific type of real estate trade: you buy an old house in a good neighborhood, tear it down, build something new, and sell it for significantly more than you put in. The math works when the land is valuable but the structure is not. The hard part is finding those properties before someone else does.
There are tools that show you listings. There are no tools that tell you which ones are actually worth buying, demolishing, and rebuilding. So I built one.
The Core Idea
The opportunity only exists when the predicted value of a new build on a lot outweighs the cost of acquiring the current property plus the cost of construction. That is the formula:
Opportunity = Predicted Rebuild Value minus (Acquisition Cost + Construction Cost)
Positive means potentially profitable. The bigger the number, the more interesting the deal. I wanted to compute that for every single family home in the Florida ZIP codes I cared about and see what came out the other side.
How It Works
The system has three main pieces.
The data engine is a Python service that scrapes MLS listing data from Realtor.com using HomeHarvest. It runs in monthly chunks to avoid hitting result caps, pauses between requests, and cleans everything before it touches the database. Single family homes only, between $100k and $5M, built after 1901, under 5,000 sqft. If it does not have coordinates it gets dropped. The clean records go into Postgres.
The ML model is where the actual prediction happens. I trained an XGBoost model on recent sales in the same target markets. The key feature is a hyper-local one I calculated myself: the average price per sqft of newly built homes within a 0.5 mile Haversine radius of each property. That number captures neighborhood-level new construction premiums way better than ZIP code alone. The model outputs a predicted rebuild value, which feeds directly into the opportunity score. You can also swap to Random Forest, Ridge Regression, or LightGBM from the UI and compare R² scores across training runs.
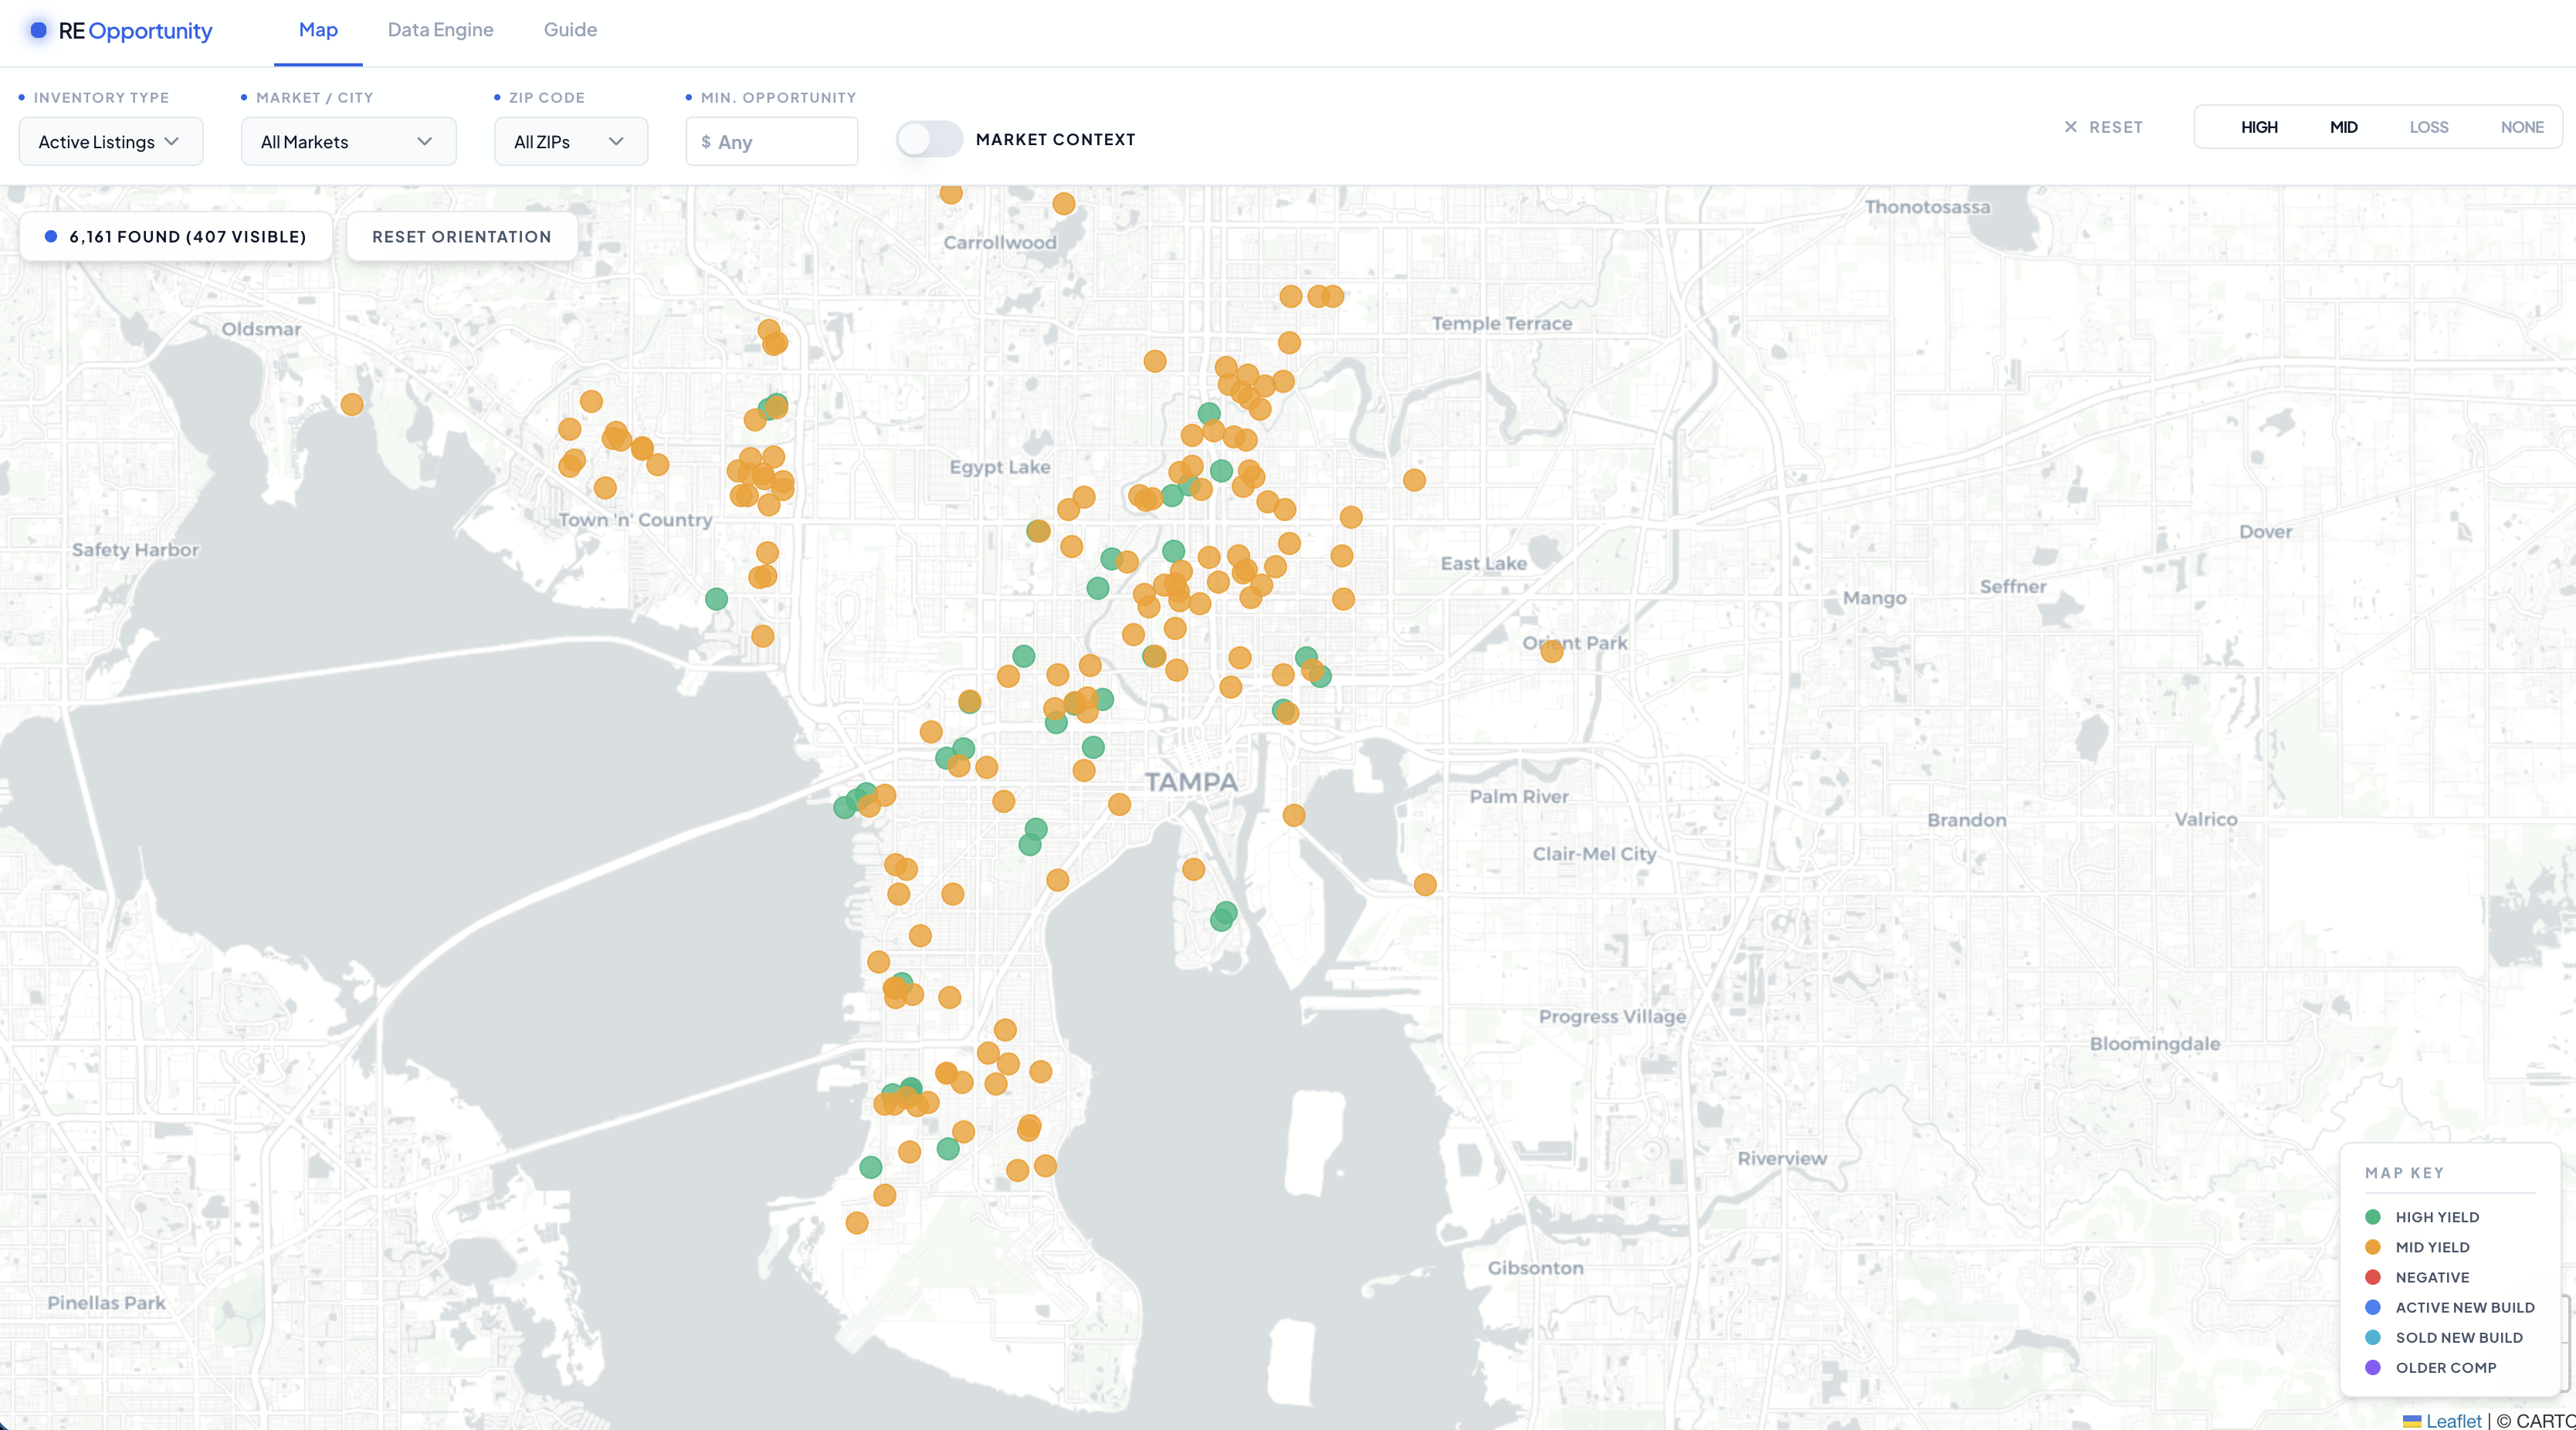
The dashboard is a React app with a Leaflet map. Green dots are the best opportunities, yellow are marginal, red are negative. Click any property and you see the full valuation breakdown plus comparable sales within 0.5 miles, prioritizing new construction. There is a market context toggle that layers active new build listings so you can see what the competition is actually asking right now.
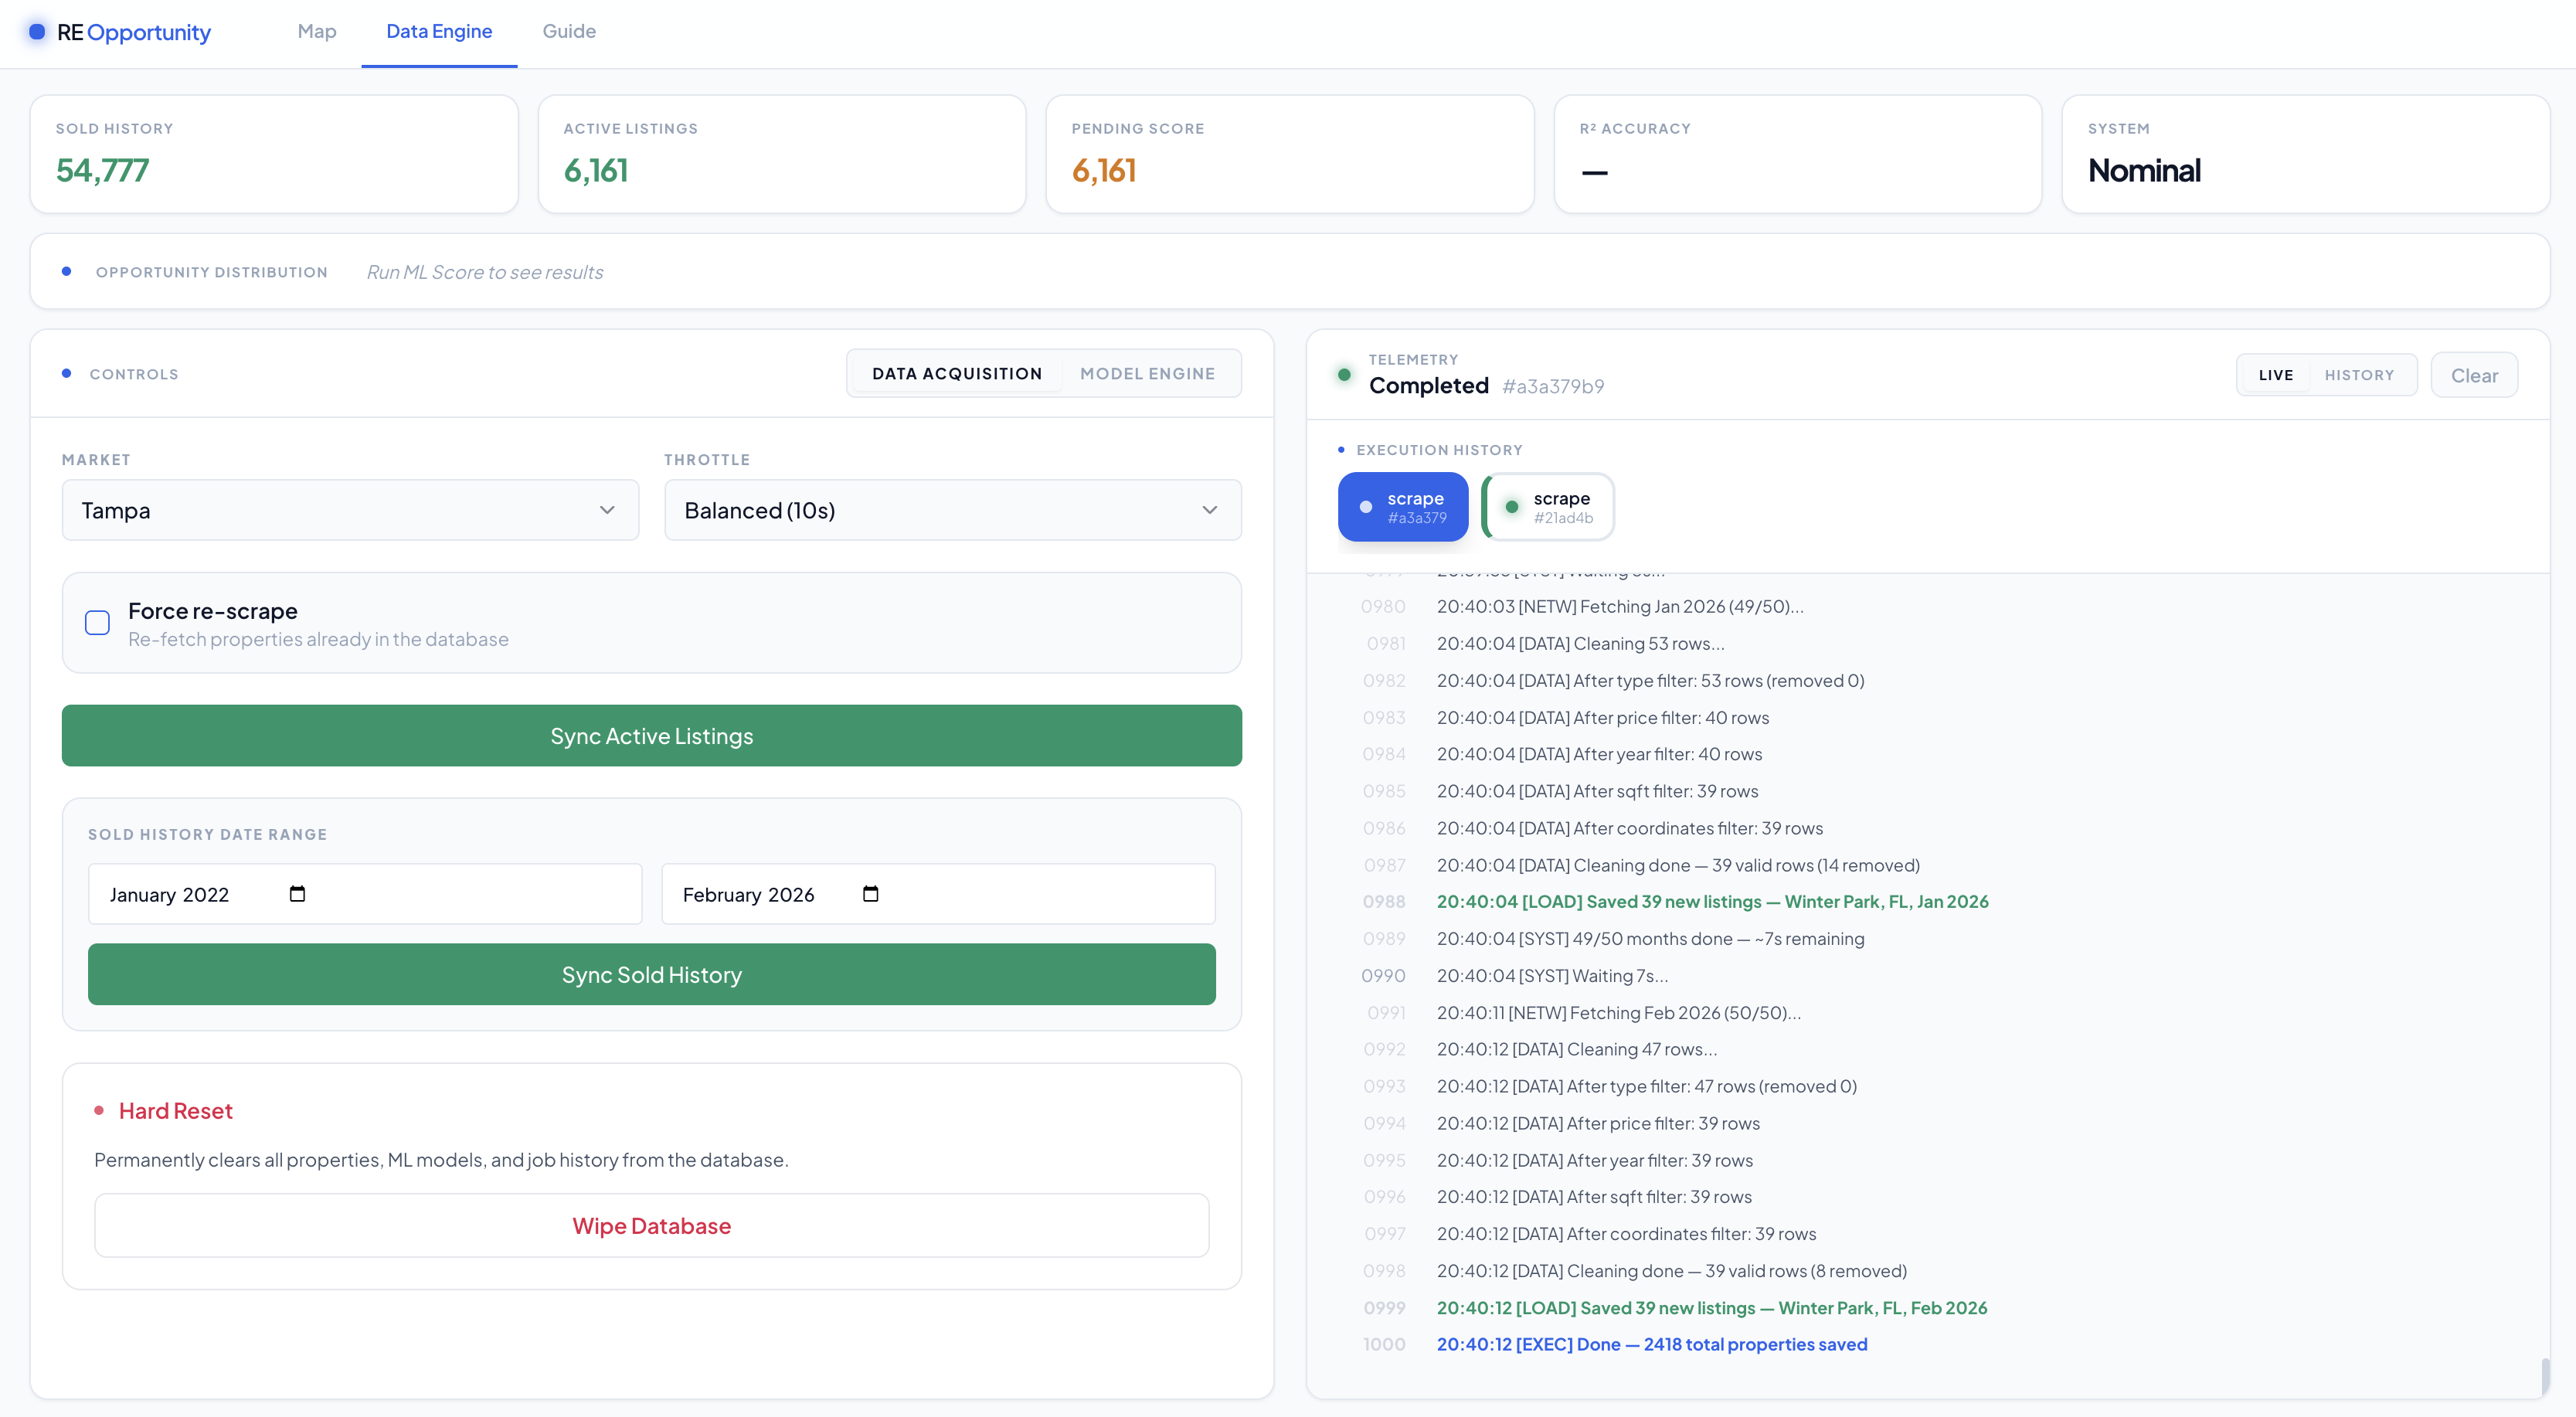
The operations panel lets you kick off scrape and training jobs from the browser, watch live console output as they run, and review a persistent history of past jobs.
The whole stack runs in Docker Compose. Postgres data lives in a named volume so it survives restarts. In production a Caddy reverse proxy handles HTTPS automatically.
What I Learned
The 0.5 mile radius feature made a bigger difference than any model tuning I did. ZIP code is too coarse. Two houses on the same block can face completely different new construction markets depending on which direction walkable amenities are. Once I computed the hyper-local baseline, the R² scores jumped noticeably across every algorithm I tried.
I also learned that data cleaning is the actual product. Getting bad records out before training matters more than picking the right model. A condo listed as a single family home will tank your predictions for an entire neighborhood if you let it through.
The scraper rate limiting was less annoying than I expected. Chunking requests by month and randomizing the pause between them kept everything clean.
The code is on GitHub. You will need a Census API key and Postgres credentials to run it locally, but the Docker Compose setup handles everything else.
Note: This tool is for personal research and analysis. Not financial advice.